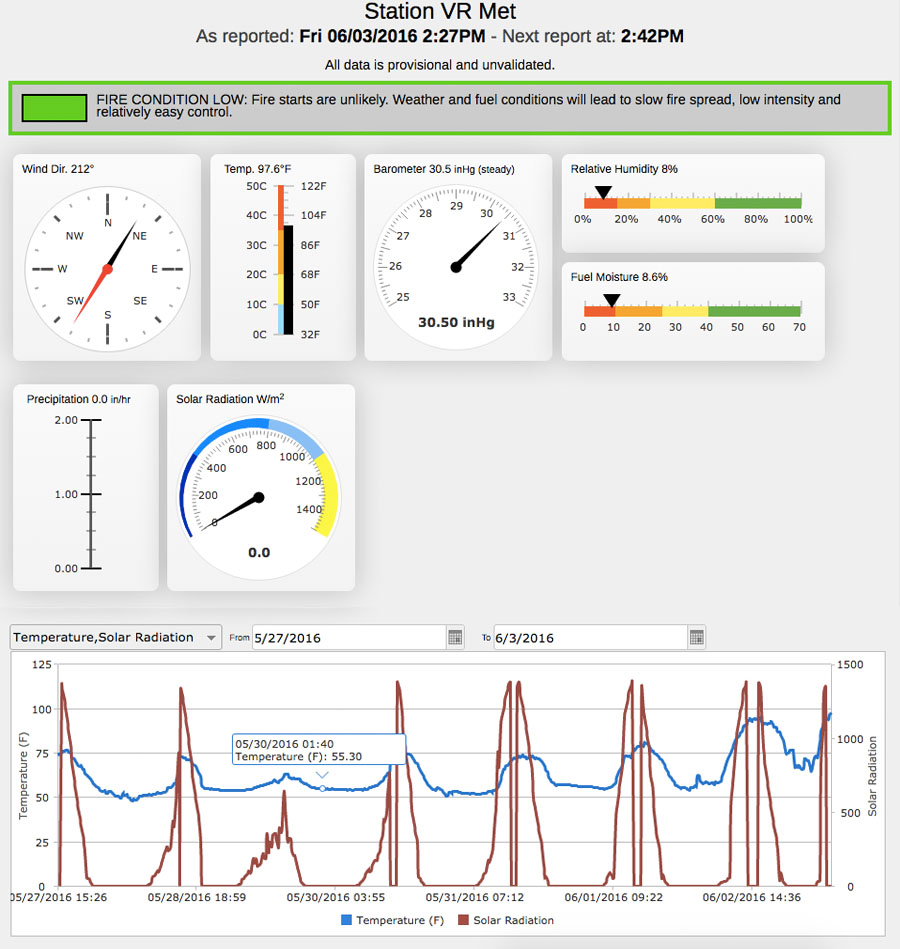
 Do you want to put your real-time, mobile Industrial IoT sensor information on an Esri ArcGIS map?
This tutorial shows you how easy it is to use Valarm APIs and the Esri ArcGIS JavaScript API to do just that!
In order to set up your Valarm APIs, see this blog post and video to learn how you configure Valarm’s APIs for JSON, KML, CSV, and GeoRSS. You can also see Valarm’s API Documentation pages to learn more about Valarm Tools Cloud’s APIs.
You have two options for how you want to use the Valarm API:

 Latest – gives you however many of the most recent alerts you’d like or
- Query – allows you to specify begin and end dates for your sensor data as well as which sensors you would like the API feed to contain.
Once you have your Valarm API URL you can put your real-time sensor data on the map by using a jQuery AJAX call to Valarm’s cloud servers and then create a feature on the map using the geo-tagged sensor data. In this example we’re using a meteo weather sensor and you can use any Valarm compatible sensors like those for:
- Air Quality

 (PM2.5, Dust, Particulates, Pollution, Gases, Ozone / O3, Nitrous Oxides / NOx, Sulfur Dioxide / SO2, Hydrogen Sulfide / H2S, Nitric Oxides / NO, and any other specific gases)
 - Water Monitoring Solutions + Systems
- Fleet vehicles, trucks, and trailers loaded up with equipment like pumps, vacuums, tanks, generators, motors, and any other industrial equipment and assets
- Water Usage – Water well levels and flow meters
- Chemical Distribution – Tank Volumes and Levels
- Remote Environmental Monitoring
 – Weather, Wild Fire Risk, Temperature, Humidity, Wind Speed, Rain / Precipitation, Wind Direction, Soil Moisture / Temperature
 - Water Quality – pH, Total Dissolved Solids / TDS, Oxidation Reduction Potential / ORP, Ions, Chemicals, Pollution, Electrical Conductivity / EC
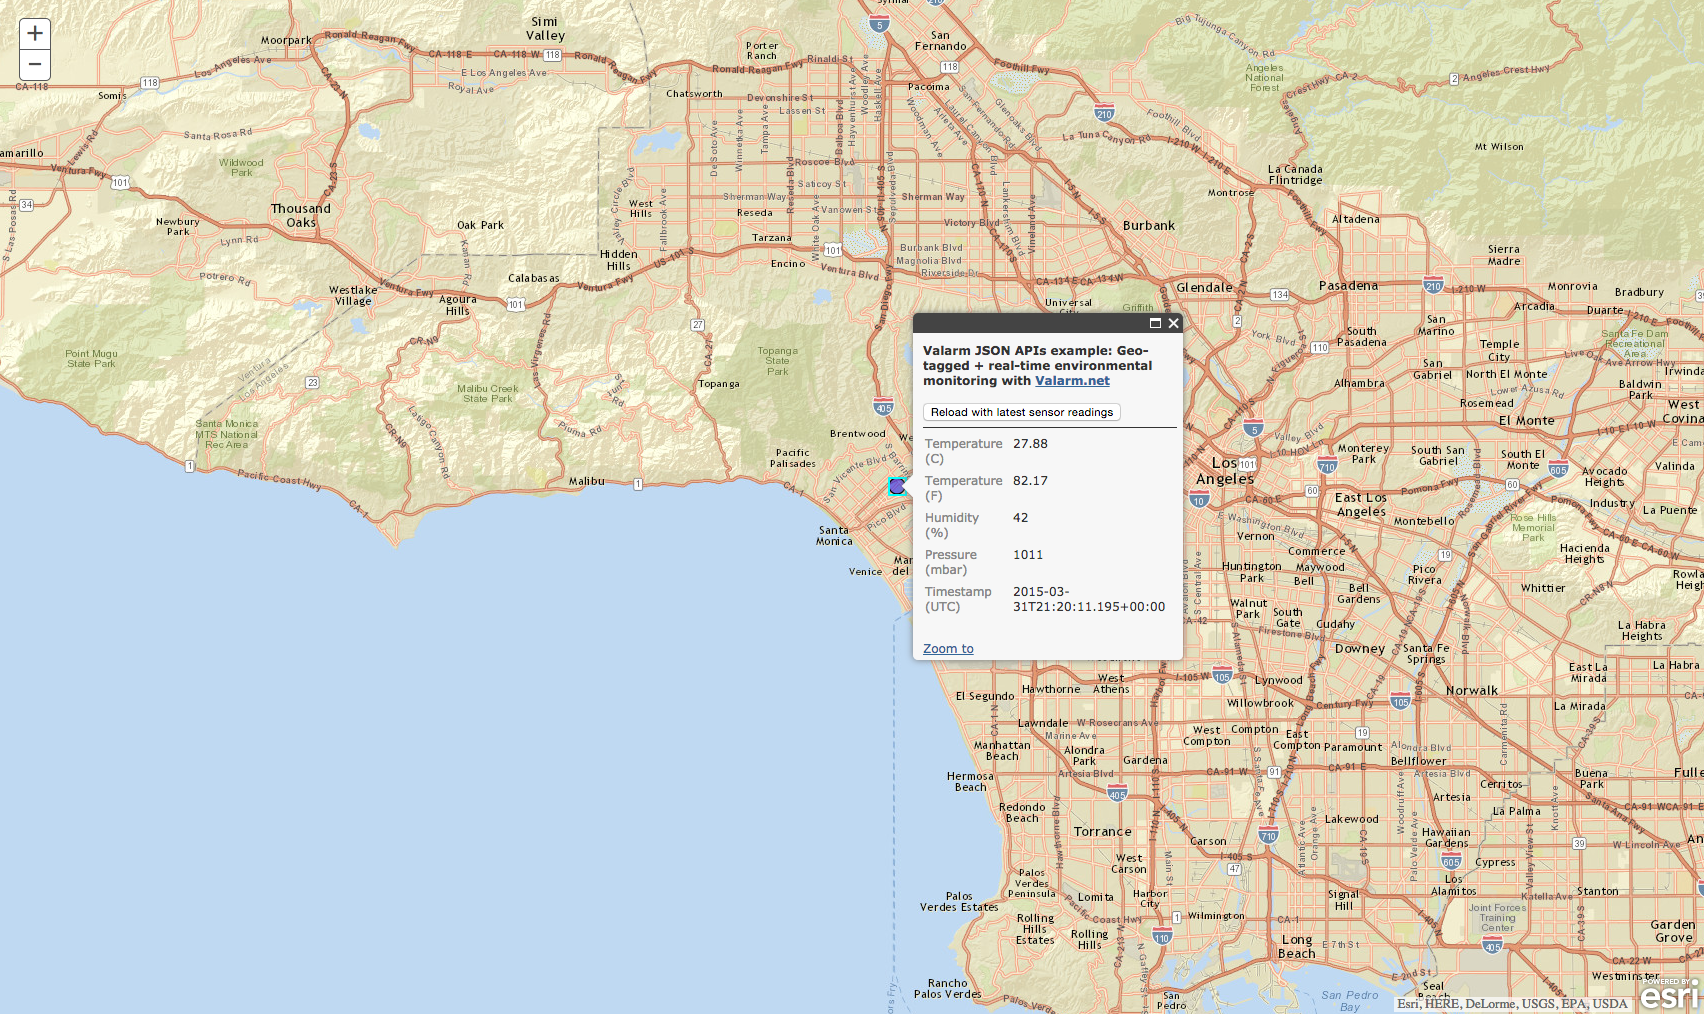
The full HTML source for this tutorial demo is available here. In this example we get the latest Valarm sensor data (temperature, humidity or air quality, VOCs) then put it in a popup window on the map. Use your web browser to view the source code.
Below is an overview of some of the basic steps:
//Define a FeatureService for Valarm's JSON sensor data
var jsonFS = {
  "geometryType": "esriGeometryPoint",
  "spatialReference": { "wkid" : 4326 },
  "features": []
 };
//Use the Valarm API to get the latest sensor data on domReady.
//Then save the geo-tagged sensor data.
require(["esri/map", "esri/layers/FeatureLayer", "dojo/domReady!"], function(Map) {
  $.ajax({
    url: "http://tools.valarm.net/api/public/device/55145b39e4b06add4744e6f9/latest.json?callback=?",
    async: false,
    dataType: "jsonp",
    success: function(data) {
      lat = data.events[0].location.lat;
      lng = data.events[0].location.lng;
      temperature = data.events[0].weather.tmp;
      humidity = data.events[0].weather.hum;
      pressure = data.events[0].weather.bar;
      time = data.events[0].timestamp;
      init();
    }
  });
});
//Create a FeatureLayer based on the Feature Collection and
//make the features pop up when clicked.
featureLayer = new esri.layers.FeatureLayer(featureCollection, {
  id: 'ValarmLayer',
  infoTemplate: popupTemplate
});

dojo.connect(featureLayer,"onClick",function(evt){
  map.infoWindow.setFeatures([evt.graphic]);
});
//Set up symbology, rendering, and add the Valarm sensor data to the map.
var defaultSymbol =
  new esri.symbol.SimpleMarkerSymbol().setColor(new dojo.Color([0, 0, 255, 0.5]));
var renderer = new esri.renderer.UniqueValueRenderer(defaultSymbol, "humidity");
featureLayer.setRenderer(renderer);
map.addLayer(featureLayer);
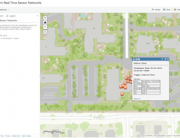
Here’s some screenshots of the sample JavaScript + HTML page:
Change the code to point to your Valarm sensor data and feel free to customize the map to your liking. Add your logo, more layers, and also an auto-refresh to continuously grab your latest sensor data using the Valarm APIs!
Also check out our step-by-step tutorial guide on how to use the Valarm JSONP API with the NVD3 Graphing API to create awesome real-time sensor graphs on your websites!
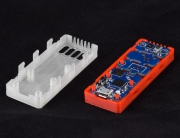
Purchase your sensors hubs to upload your sensor data in the cloud.
Valarm compatible sensors are available at shop.valarm.net.
You can configure your Valarm APIs at tools.valarm.net.
Please don’t hesitate to contact us at Info@Valarm.net if you have any questions.


